Childhood Lead Poisoning Dashboard for Kids Under 6
There is no safe level of lead in the human body and even very low levels of exposure can be harmful. The Centers for Disease Control and Prevention defines lead poisoning as a blood lead level at or above 3.5 micrograms per deciliter (μg/dL).
Contents
- Data from Past Year (October 2017 – September 2023)
- Number of kids tested for lead poisoning
- Number of kids tested with an elevated blood lead level
- Race of kids tested (when available)
- Ethnicity of kids tested (when available)
Understanding the Data Methods and Analysis
- The data shown are reported ‘totals of children 6 years old or younger (at or below 72 months of age) at the time their blood lead sample was drawn’ from the following sources:
- Quarterly summary reports from the Southern Nevada Health District (SNHD)
- Line-item data from the Nevada Department of Health and Human Services (NDHHS)
- These include venous, capillary, and unknown samples. Not all capillary samples that are above the CDC’s current reference value were confirmed by a follow-up venous sample.
- Preliminary data from reports are uploaded on a quarterly basis as ‘The Latest Data’ by calendar quarters (October-December, January-March, April-June, July-September). Data are re-uploaded on a yearly basis as ‘Data from Past Year’ by 12-month time period (e.g. October 2021 – September 2022) after being rerun with additional race/ethnicity information from Medicaid that are only provided on an annual basis.
- For ‘The Latest Data’, each individual child’s latest case is counted once per quarter. If the latest case includes an individual child with multiple lab tests per day, only the highest venous reported test is counted (or lowest capillary, if no venous test is available).
- For ‘Data from Past Year’, the data are re-analyzed one quarter at a time for the previous reporting year with the Medicaid match for the same year. We use the latest blood lead result from each individual child.
- A blood lead concentration of ≥ 3.5 µg/dL is defined by the federal Centers for Disease Control and Prevention. Those BLLs reported as equal to or greater than 3.5 µg/dL are determined as higher than most children and included in the category “Lead Exposure Above the Blood Lead Reference Value (BLRV) ”
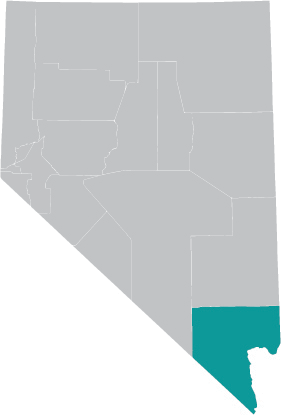
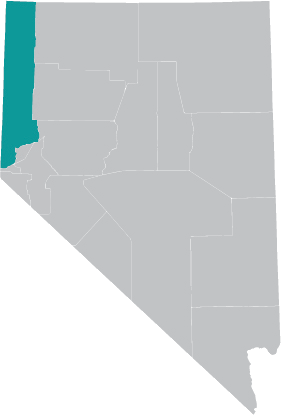
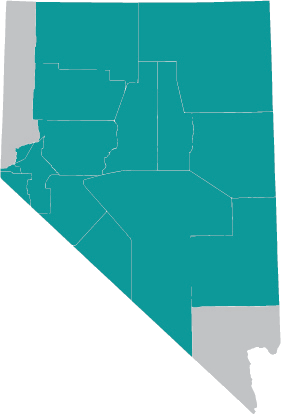
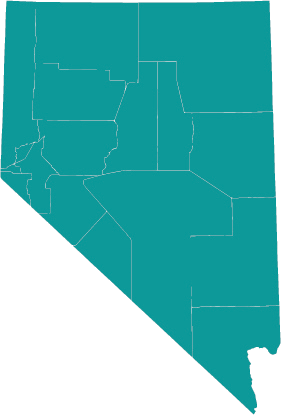
- The Nevada state icons in the top row of the table only provide a geospatial visualization of counties in Nevada. Where possible, data are divided by “Clark County”, “Washoe County”, “Rural Counties” (all other 15 counties combined), and “Nevada” (total count for the state).
- For previous years, county was determined by:
- Assuming that all results reported to the SNHD are in Clark County
- Grouping results using “Patient Zip” variable from the NDHHS reports and separating them into zip codes found in “Washoe County” and “Rural Counties” (all other zip codes combined)
- For the latest quarters, county was determined by:
- Assuming that all results reported to the SNHD are in Clark County
- Grouping results using the “Jurisdiction Name” variable from the NDHHS reports and separating them into “Washoe County” and “Rural Counties” (all other Jurisdiction Names combined)
- NvCLPPP’s data suppression guidelines are in accord with those listed in the CDC’s Childhood Blood Lead Surveillance (CBLS) DMP. Because CBLS datasets include some required variables with potentially personally identifiable information (PII) (e.g., age, race, sex, county of address) which may present privacy concerns due to small numbers for some of the variables, small cell sizes will be redacted from all datasets or summary tables for public release.
- Data Suppression Rules for Public Release:
- To maintain confidentiality, the Nevada Childhood Lead Poisoning Prevention Program shares data in aggregate and follows these rules based on guidelines from the SNHD and the NDHHS Office of Analytics’ Nevada Suppression Rule:
- Suppress any cell where the count ‘x’ is ≤ 5 (including totals)
- If only one value in a row or column is suppressed and the value can be back-calculated using the row/column total and/or remaining cell values, suppress an additional cell in that row/column
- To maintain confidentiality, the Nevada Childhood Lead Poisoning Prevention Program shares data in aggregate and follows these rules based on guidelines from the SNHD and the NDHHS Office of Analytics’ Nevada Suppression Rule:
- Data Suppression Rules for Public Release:
- For previous years, county was determined by:
Data Limitations:
- Data presented are preliminary and may change.
- The accuracy and completeness of data relies on reports received by the SNHD and the NDHHS from healthcare providers, public health laboratories, and commercial laboratories. Results that are not submitted to SNHD or NDHHS would not be included.
Race and Ethnicity Data Limitations:
- Reports received are sometimes incomplete regarding race and ethnicity information.
- The accuracy and completeness of race and ethnicity of aggregate data from previous years relies on the reports submitted to SNHD or NDHHS as well as data from Nevada Medicaid. Medicaid recipients race and ethnicity information are matched to existing blood lead level data on a yearly basis. The race and ethnicity of children not submitted to SNHD or NDHHS and who were not Medicaid recipients at the time of the match request would not be included here.
- Race and ethnicity data are shared on a statewide level only.
- Race data only records a single race for each child.
- Race is limited to the following categories:
- American Indian or Alaskan Native
- Asian
- Black and African American
- Missing
- Native Hawaiian or Other Pacific Islander
- Other
- Unknown
- White
- Ethnicity is limited to the following categories:
- Hispanic
- Missing
- Non-Hispanic
- Other
- Unknown
- The variable other indicates: Person’s race is “Other” than the presented options.
- The variable unknown indicates: “Unknown” race was selected for person’s race.
- The variable missing indicates: No race data are available for this person.
Data from Past Year (October 2017 – September 2023)
Number of Kids Tested for Lead Poisoning in Nevada
| Date | Clark County | Washoe County | All Other Counties | Nevada |
| October 2017 – September 2018 | 7926 | 342 | 540 | 8808 |
| October 2018 – September 2019 | 6797 | 292 | 577 | 7666 |
| October 2019 – September 2020 | 4699 | 216 | 446 | 5361 |
| October 2020 – September 2021 | 5748 | 205 | 410 | 6363 |
| October 2021 – September 2022 | 5955 | 326 | 530 | 6811 |
| October 2022 – September 2023 | 5418 | 325 | 441 | 6184 |
Number of Kids Tested With An Elevated Blood Lead Level in Nevada
| Date | Clark County | Washoe County | All Other Counties | Nevada |
| October 2017 – September 2018 | 165 | 73 | 113 | 351 |
| October 2018 – September 2019 | 93 | – | – | 103 |
| October 2019 – September 2020 | 43 | – | – | 47 |
| October 2020 – September 2021 | 80 | – | – | 83 |
| October 2021 – September 2022 | 57 | – | – | 69 |
| October 2022 – September 2023 | 52 | 21 | 11 | 84 |
Race of Kids Tested for Lead Poisoning in Nevada
| Date | American Indian or Alaskan Native | Asian | Black and African American | Native Hawaiian or Other Pacific Islander | White | Other | Unknown | Missing |
| October 2017 – September 2018 | 22 | 14 | 861 | 131 | 3749 | – | 3820 | – |
| October 2018 – September 2019 | 26 | 123 | 712 | 0 | 3395 | 33 | 1662 | 0 |
| October 2019 – September 2020 | 0 | 144 | 366 | 0 | 579 | 913 | 4066 | 2866 |
| October 2020 – September 2021 | 26 | 123 | 712 | 0 | 3395 | 33 | 1662 | 0 |
| October 2021 – September 2022 | 37 | 202 | 1077 | – | 618 | 559 | 4840 | – |
| October 2022 – September 2023 | 33 | 120 | 510 | 0 | 923 | 666 | 3932 | 0 |
Ethnicity of Kids Tested for Lead Poisoning in Nevada
| Date | Missing | Hispanic | Non-Hispanic | Other | Unknown | |
| October 2017 – September 2018 | 0 | 3248 | 2149 | 0 | 3206 | |
| October 2018 – September 2019 | 82 | 3045 | 1759 | 0 | 1070 | |
| October 2019 – September 2020 | 21 | 1944 | 1464 | 92 | 5430 | |
| October 2020 – September 2021 | 0 | 2625 | 1681 | 132 | 6437 | |
| October 2021 – September 2022 | 0 | 1791 | 1373 | 0 | 3670 | |
| October 2022 – September 2023 | 0 | 2053 | 1724 | 0 | 2407 |
