Nevada’s Lead Exposure Risk Index
Geographic Areas of Priority
ZIP codes in deciles 1, 2, and 3 are considered low-risk.
ZIP codes in deciles 4, 5, 6, and 7 are considered medium-risk.
Lastly, ZIP codes in deciles 8, 9, and 10 are considered as areas at high-risk for lead exposure and are NvCLPPP’s areas of priority.
| Decile Range | LERI Range | Ranking |
|---|---|---|
| 1st-3rd | 0.10-2.09 | Low-risk |
| 4th-7th | 2.09-2.56 | Medium-risk |
| 8th-10th | 2.56-2.95 | High-risk |
LERI by risk ranking for Nevada’s ZIP codes.
Figure 1 highlights high-risk ZIP codes for the state.
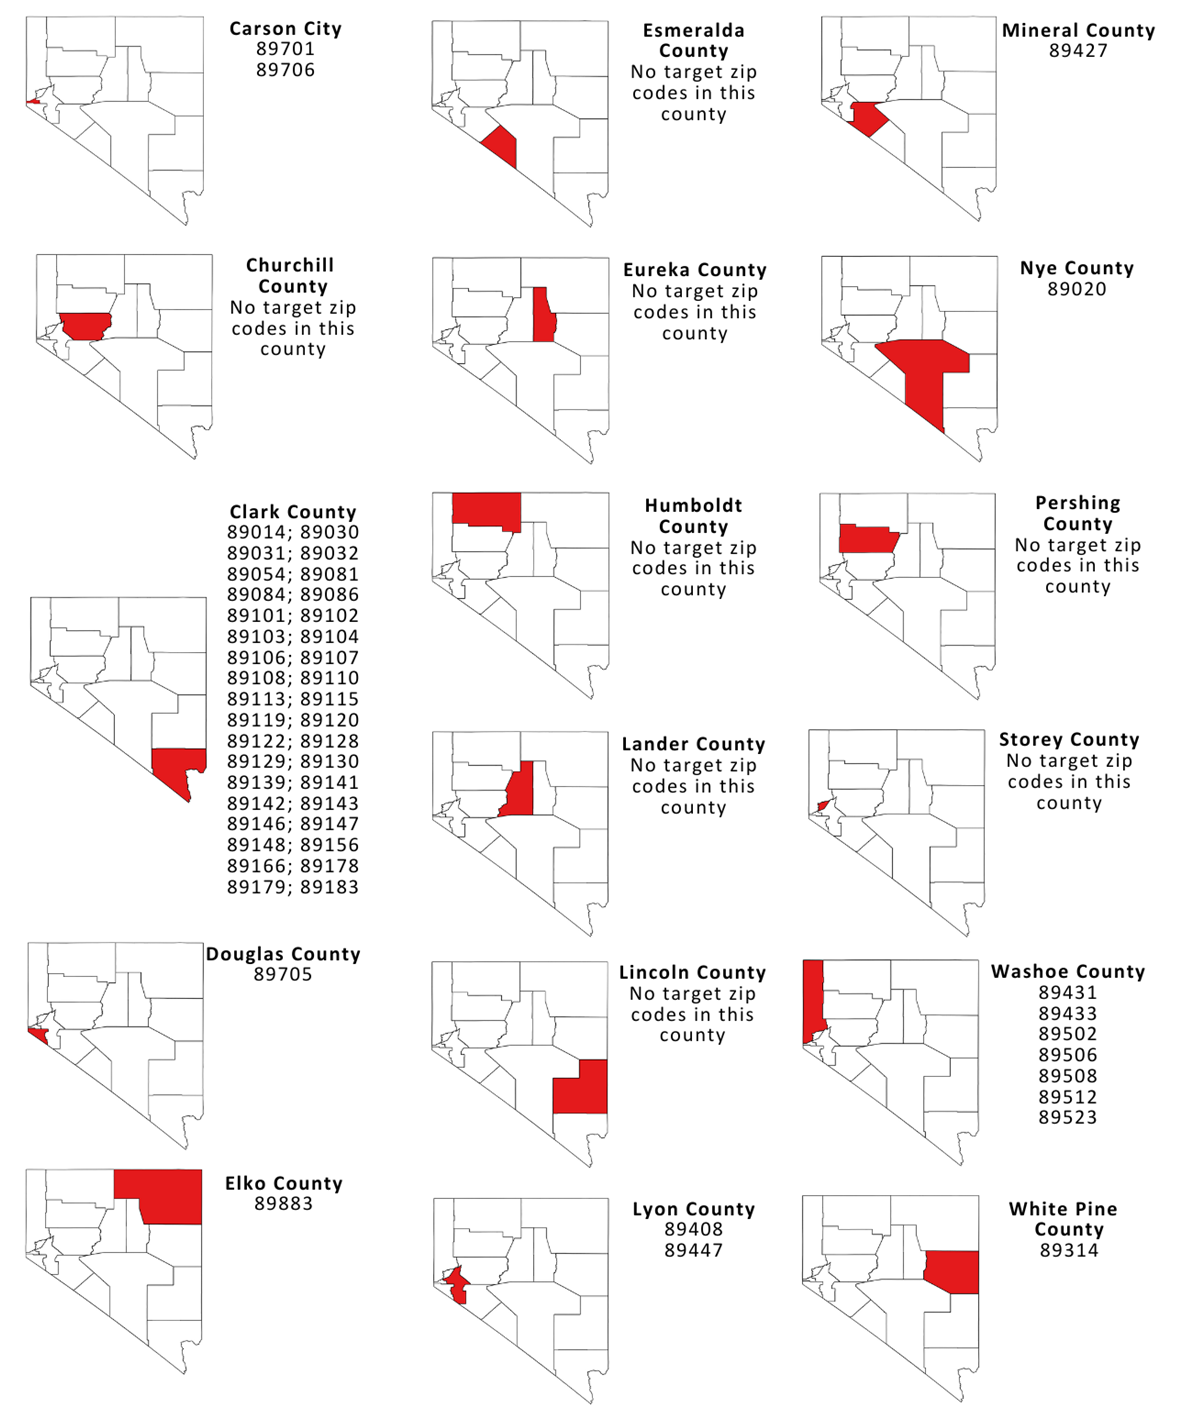 Figure 1: ZIP codes with the highest lead exposure risk by county.
While blood lead surveillance data was not incorporated at this time due to low screening rates, the NvCLPPP plans to improve the collection of epidemiologic data to be able to include race and ethnicity of BLL above the BLRV and other BLL data in future surveillance maps.
Methodology
The Nevada Lead Exposure Risk Index (LERI) was developed at the ZIP code level using the following methodology:
Initially, we identified the key variables to incorporate into the index. To inform this selection process, we referred to the work of Jacob and colleagues (Jacobs, et al., 2002), who conducted an extensive study estimating the prevalence of significant LBP hazards in housing units across the country.
We extracted household data by ZIP code pertaining to six critical characteristics from the American Community Survey, specifically focusing on:
- Age of housing
- Housing unit type
- Occupant status
- Household income
- Race
- Ethnicity
These variables were chosen based on their inclusion in Jacob et al.’s study, and we obtained the percentages of housing units with lead hazards from their research:
| Characteristic | Percent with lead hazards |
|---|---|
| Age of housing | |
| After 1980 | 3% |
| 1960-1979 | 8% |
| 1940-1959 | 43% |
| Before 1940 | 68% |
| Housing unit type | |
| Single family | 26% |
| Multifamily | 19% |
| Occupant status | |
| Owner occupied | 23% |
| Renter occupied | 30% |
| Household income | |
| <$30,000/year | 35% |
| ≥$30,000/year | 19% |
| Race | |
| White | 25% |
| African American | 29% |
| Other | 23% |
| Ethnicity | |
| Hispanic/Latino | 32% |
| Non-Hispanic/Latino | 24% |
Percentage of homes with lead hazards by household characteristics.
We made slight adjustments to the first two age of housing categories, “after 1980” and “1960-1979“, to align them with the available categories in our household data. The subsequent step involved calculating , the weighted risk score for each household characteristic, using the following formulas:


 indicates the number of households of a specific household characteristic.
 ) and the poverty rate (
 ) into the LERI formula.
 indicates the risk weight for a given risk score
  .
. ), the fourth step applied factor analysis to reconstruct the formula using a reduced number of factors that could still adequately represent the original eight variables. The updated formula is expressed as:
 is less than eight,
  is the weight of the pth factor score
  , and c is a constant used to scale the LERI, ensuring that it remains strictly positive.
 explained by
  to make the total weights equal to 1.